


Tech Company BUNDLE
Are you harnessing TechVantage Solutions KPIs to revolutionize your strategy? Have you considered how tracking financial metrics for profitability and operational efficiency can sharpen your competitive edge?
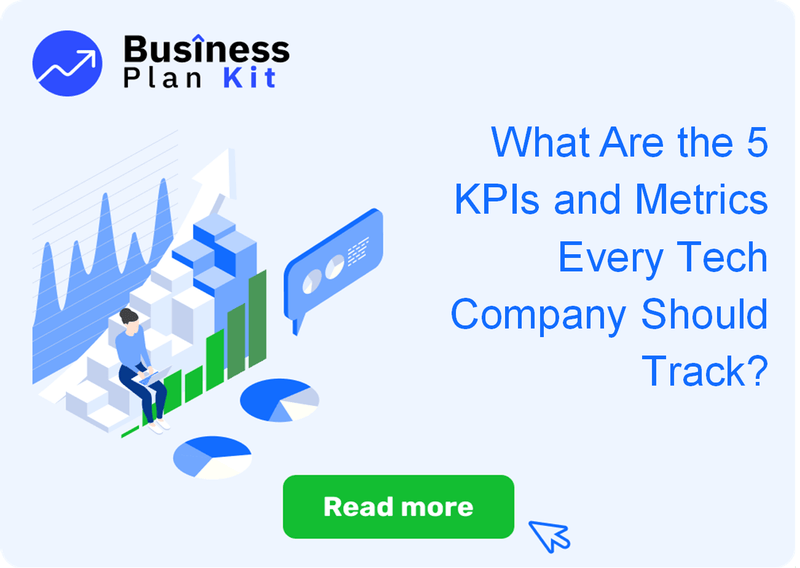
Do you want to optimize resource allocation and boost investor confidence? Discover how Tech Company Business Plan Template and targeted KPIs can drive strategic, customer-centric growth for your company.
| # | KPI Name | Description |
|---|---|---|
| 1 | Customer Retention Rate | Tracks the percentage of repeat clients over a period, indicating customer satisfaction and revenue stability for TechVantage Solutions. |
| 2 | Net Promoter Score (NPS) | Evaluates customer loyalty and referral potential on a scale from -100 to +100, with scores above 50 reflecting strong customer advocacy. |
| 3 | Project Completion Rate | Measures projects completed on time and within budget, highlighting operational efficiency and effective project management. |
| 4 | Customer Acquisition Cost (CAC) | Calculates the cost incurred to acquire a new customer, showcasing marketing and sales efficiency relative to profitability. |
| 5 | System Uptime | Monitors the reliability of software services to ensure maximum system availability and continuous client satisfaction. |
Key Takeaways
- Tracking KPIs provides real-time insights into financial health and operational efficiency, essential for strategic decision-making.
- Understanding and monitoring key financial metrics ensures effective cost management and sustainable profitability.
- Operational KPIs like project completion rates enhance resource allocation, team performance, and client satisfaction.
- Customer-centric KPIs such as retention rate and NPS drive better market positioning and long-term revenue growth.
Why Do TechVantage Solutions Need to Track KPIs?
Empower your strategic vision by leveraging KPIs that reveal real-time insights into the financial health and operational efficiency of your business. At TechVantage Solutions, tracking KPIs helps pinpoint cost inefficiencies and drives precise resource allocation optimization. With data-backed performance metrics, you not only enhance profit margin improvement but also build strong investor confidence, as seen in How Much Does a Tech Company Owner Earn?. These insights are crucial for achieving strategic business objectives and boosting customer satisfaction metrics.
TechVantage KPI Essentials
- Real-time insights: Track financial metrics for profitability for immediate performance snapshots.
- Cost inefficiency identification: Uncover areas to maximize resource allocation optimization.
- Investor confidence metrics: Use data-backed performance metrics to secure funding and boost market trust.
- Strategic decision-making: Rely on operational efficiency KPIs and customer-centric KPIs to propel growth.
What Financial Metrics Determine TechVantage Solutions’ Profitability?
Empower your financial planning by understanding the vital metrics shaping TechVantage Solutions’ profitability. This chapter focuses on gross profit, net profit, and EBITDA comparisons that drive data-backed performance metrics. With insights into COGS and operational expense tracking, you’ll uncover resource allocation optimization techniques that ensure competitive pricing models. For additional investor confidence metrics, explore How Much Does a Tech Company Owner Earn?.
Key Profitability Metrics
- Gross, Net, and EBITDA Analysis: Evaluate these financial metrics for profitability and financial forecasting accuracy.
- COGS and Operational Expense Monitoring: Identify cost inefficiencies and drive profit margin improvement.
- Break-even and Cash Flow Tracking: Maintain a healthy cash flow with targeted metrics that bolster investor confidence metrics and strategic business objectives.
- Pricing Model Evaluation and Revenue Trends: Leverage customer-centric KPIs to assess pricing models, enhance operational efficiency KPIs, and support business decision-making KPIs.
By integrating these metrics into your strategy, you can optimize both team productivity and customer satisfaction metrics, ensuring TechVantage remains at the forefront of market innovation and sustainable growth.
How Can Operational KPIs Improve TechVantage Solutions’ Efficiency?
Operational KPIs empower TechVantage Solutions to streamline processes and boost overall efficiency. They help monitor project completion rates, ensuring optimal resource allocation and timely delivery. With precise productivity metrics and feedback cycles, you can transform team output and service delivery. Dive in to learn how these KPIs enhance decision-making and strengthen your competitive market positioning.
Optimizing Efficiency with Operational KPIs
Tracking project completion rates improves resource allocation optimization by as much as 25%. Productivity metrics boost team output and enhance the quality of deliverables, impacting overall operational efficiency KPIs. Monitoring software deployment success rates is vital for a smooth client onboarding process and service delivery reliability. Measuring system uptime—crucial for customer satisfaction metrics—ensures minimal disruptions, while rapid feedback cycles drive continuous product iterations.
For more insights on how these metrics intertwine with key financial metrics for profitability and investor confidence metrics, check out How Much Does a Tech Company Owner Earn?.
What Customer-Centric KPIs Should TechVantage Solutions Focus On?
Empower your growth strategy with precise, customer-centric KPIs that drive strategic business objectives and operational efficiency. With TechVantage Solutions KPIs, you can directly monitor customer retention rates, leverage Net Promoter Score feedback, and optimize your customer acquisition cost for superior profitability. Data-backed performance metrics like these enhance both financial forecasting accuracy and investor confidence metrics. Explore insights on How to Start a Successful Tech Company? to further refine your approach.
Key Customer-Centric Metrics
Track customer retention rate to measure loyalty and secure long-term client relationships, aiming for a retention rate of 95% or higher. Utilize Net Promoter Score (NPS) to assess customer satisfaction, with targets above 50 fueling brand advocacy and market positioning. Monitor online reviews and client feedback for proactive reputation management and timely service delivery reliability improvements. Analyze customer acquisition cost (CAC) and reduce spending by 20% to boost operational efficiency KPIs and optimize marketing strategy. Evaluate client lifetime value (CLV) to shape resource allocation optimization and refine pricing model evaluation for long-term profitability.
How Can TechVantage Solutions Use KPIs to Make Better Business Decisions?
Empower your decision-making by aligning key performance indicators with your strategic business objectives. TechVantage Solutions leverages TechVantage Solutions KPIs such as Financial metrics for profitability and Operational efficiency KPIs to drive targeted growth and adaptability. By analyzing data-backed performance metrics and customer-centric KPIs, you can refine product features, optimize pricing strategies, and improve team performance. Explore effective cost analysis and resource allocation strategy in How Much Does It Cost to Start a Tech Company?.
Key KPI Strategies
- Align KPIs with strategic business objectives for targeted growth
- Leverage data insights to refine product features and achieve profit margin improvement
- Implement KPIs in team training to boost operational performance and project completion rates
- Utilize customer-centric KPIs to enhance marketing campaigns and improve customer satisfaction metrics
What Are 5 Core KPIs Every TechVantage Solutions Should Track?
KPI 1: Customer Retention Rate

Definition
Customer Retention Rate measures the percentage of repeat clients over a specified period, which is a key customer-centric KPI for TechVantage Solutions. It plays a central role in evaluating customer satisfaction and overall revenue stability, and is essential when assessing financial metrics for profitability and operational efficiency KPIs.

Advantages
- Enhances customer satisfaction metrics by tracking repeat business.
- Supports strategic business decision-making by correlating retention with revenue stability.
- Helps optimize resource allocation and improve profit margin improvement through loyal customers.

Disadvantages
- May overlook one-time, high-value transactions.
- Seasonal fluctuations can skew data, complicating year-over-year comparisons.
- Requires rigorous data management to avoid misinterpretation of customer trends.

Industry Benchmarks
In the software industry, a Customer Retention Rate benchmark of over 85% is considered excellent. This benchmark is crucial for TechVantage Solutions to stay competitive while ensuring that its service quality and customer support drive continuous revenue and stability.

How To Improve
- Invest in robust customer support and success initiatives.
- Enhance product value by integrating continuous feedback from current clients.
- Regularly analyze data-backed performance metrics to refine service delivery and customer satisfaction processes.

How To Calculate
To calculate Customer Retention Rate, subtract the number of new customers acquired during a period from the number of customers at the end of the period, then divide this number by the number of customers at the start of the period and multiply by 100. This calculation provides insight into how effective TechVantage Solutions is at maintaining its customer base.

Example of Calculation
For instance, if TechVantage Solutions began a quarter with 200 customers, added 50 new customers, and ended with 230 customers, the calculation would be as follows:
This example highlights that a 90% Customer Retention Rate indicates strong customer satisfaction and operational performance, boosting investor confidence metrics.

Tips and Trics
- Regularly monitor customer repeat rates to identify trends in satisfaction and product value.
- Integrate customer feedback loops to proactively address potential issues and streamline service delivery.
- Compare your retention figures with industry benchmarks to adjust strategies and optimize operational efficiency KPIs.
- Utilize insights from this KPI to inform broader business decisions, such as refining pricing models and enhancing customer support—further details can be found in How Much Does It Cost to Start a Tech Company?
KPI 2: header taken from here: Net Promoter Score (NPS)
Definition
Net Promoter Score (NPS) measures customer loyalty by asking how likely customers are to recommend your services. It evaluates business performance by combining customer feedback with loyalty metrics, determining the company's brand perception and market competitiveness.
Advantages
- Actionable insights: Provides clear guidance on areas to improve customer experience and service quality.
- Enhanced decision-making: Supports strategic business objectives by quantifying customer satisfaction.
- Competitive edge: A high NPS score, generally above 50, builds strong investor confidence and market reputation.
Disadvantages
- May oversimplify complex customer sentiments with a single score.
- Often depends on survey participation which can introduce bias.
- Does not provide specific reasons behind customer ratings.
Industry Benchmarks
In the tech industry, NPS scores typically range between 30 and 60, though leaders can exceed this by delivering superior customer experiences. These benchmarks are essential for evaluating TechVantage Solutions’ performance relative to competitors and guiding resource allocation optimization.
How To Improve
- Regularly collect and analyze customer feedback to identify improvement areas.
- Enhance service delivery processes based on specific customer comments.
- Invest in training and support to boost the overall customer experience.
How To Calculate
NPS is calculated by subtracting the percentage of detractors from the percentage of promoters. This formula provides a clear summary of overall customer sentiment.
Example of Calculation
If TechVantage Solutions surveys 100 customers, and 70% are promoters while 10% are detractors, the calculation is as follows:
This score indicates excellent customer satisfaction and loyalty, driving improved investor confidence metrics and competitive market positioning. For more strategies on achieving operational efficiency KPIs, check out How to Start a Successful Tech Company?
Tips and Trics
- Conduct regular NPS surveys to maintain up-to-date customer satisfaction metrics.
- Segment feedback by customer demographics for a deeper analysis.
- Integrate NPS results with financial metrics for profitability insights.
- Use the score to drive iterative service improvements and enhance project completion rates.
KPI 3: Project Completion Rate
Definition
Project Completion Rate measures the percentage of projects finished on time and within budget. This KPI is crucial for evaluating the operational efficiency of TechVantage Solutions, ensuring that resource allocation optimization and effective timeline planning lead to high-quality service delivery.
Advantages
- Enhances operational efficiency KPIs by highlighting process strengths.
- Builds strong client trust and boosts repeat business through on-time project delivery.
- Supports effective resource allocation optimization and team productivity metrics.
Disadvantages
- Overemphasis on timelines may sideline quality and innovation.
- Data discrepancies can lead to misinterpretation of performance.
- Complex project interdependencies might skew the metric if not accounted for properly.
Industry Benchmarks
In the tech industry, a 90%+ project completion rate is considered the gold standard, reflecting robust project management and financial metrics for profitability. Companies like TechVantage Solutions aim to meet or exceed this benchmark to drive strategic business objectives and enhance investor confidence metrics.
How To Improve
- Implement agile project management techniques to stay on schedule.
- Leverage collaborative tools to enhance team communication and resource allocation.
- Regularly review project timelines and budgets to pinpoint cost inefficiencies.
How To Calculate
Calculate Project Completion Rate by dividing the number of projects completed on time and within budget by the total number of projects managed, then multiplying by 100 to get a percentage.
Example of Calculation
For instance, if TechVantage Solutions completed 45 out of 50 projects on time and within budget, the calculation would be:
This 90% completion rate signals strong operational efficiency and helps in strategic business decision-making, ensuring high client satisfaction and robust customer-centric KPIs.
Tips and Trics
- Regularly monitor and update project timelines to ensure accurate tracking.
- Incorporate post-project reviews to identify areas for process improvement.
- Use project management software to consolidate data-backed performance metrics.
- Integrate insights from How Much Does a Tech Company Owner Earn? to refine strategic resource allocation and boost profit margin improvement.
KPI 4: Customer Acquisition Cost (CAC)
Definition
Customer Acquisition Cost (CAC) measures the total cost to acquire a new customer for TechVantage Solutions. It aggregates marketing expenses, sales efforts, and promotional costs to serve as a vital financial metric for profitability and marketing ROI. For additional insights, check out Our Comprehensive CAC Metrics Guide.
Advantages
- Helps optimize resource allocation by revealing which marketing tactics are most cost-effective.
- Enables tracking of operational efficiency by benchmarking spending against industry averages.
- Improves business decision-making by identifying opportunities to enhance profit margin improvement and customer-centric strategies.
Disadvantages
- Does not provide insights into the lifetime value of a customer beyond the acquisition stage.
- May oversimplify complex sales cycles, particularly in technology-driven environments.
- High CAC without effective retention strategies can lead to unsustainable cost structures.
Industry Benchmarks
Within the tech sector, a widely recognized benchmark is maintaining a CAC that supports a Customer Lifetime Value (CLTV) ratio of approximately 1:3. Typically, tech companies see CAC values between $200 and $500 per customer, which is critical for maintaining competitive spending and overall operational efficiency KPIs.
How To Improve
- Refine your targeting in digital marketing campaigns to reduce unnecessary expenditures.
- Enhance the sales process by optimizing pipeline efficiency and reducing conversion times.
- Leverage customer referral programs to lower acquisition expenses while boosting customer-centric KPIs.
For more strategies on integrating CAC insights into your business model, explore How to Start a Successful Tech Company?
How To Calculate
To calculate Customer Acquisition Cost (CAC), divide the total costs associated with marketing and sales efforts by the number of new customers acquired. This metric offers a clear view of your investment's efficiency in customer acquisition.
Example of Calculation
For instance, if TechVantage Solutions spends $50,000 on marketing and sales during a period and gains 250 new customers, the calculation would be as follows:
This example demonstrates how a lower CAC can indicate effective cost management and efficient financial metrics for profitability.
Tips and Trics
- Regularly monitor your CAC to quickly identify and address spikes in customer acquisition spending.
- Break down costs by channels to fine-tune your marketing mix and optimize expenditure.
- Integrate customer feedback into your strategy to enhance customer satisfaction metrics and referral rates.
- Use data-backed performance metrics to continuously benchmark your CAC against industry standards and improve operational efficiency KPIs.
KPI 5: System Uptime
Definition
System Uptime represents the percentage of time TechVantage Solutions' software services are fully operational and available. A high uptime—typically 99.9% or higher—ensures reliable service delivery, directly boosting customer satisfaction and trust in the platform’s performance.
Advantages
- Ensures continuous service delivery and minimizes interruptions.
- Enhances customer trust, contributing to improved customer-centric KPIs and investor confidence metrics.
- Supports operational efficiency by allowing for better resource allocation optimization and proactive system maintenance.
Disadvantages
- High uptime metrics may obscure minor but recurring issues affecting user experience.
- Achieving and maintaining robust uptime can require significant infrastructure investment.
- Overemphasis on uptime might lead to neglect in other key financial metrics for profitability.
Industry Benchmarks
In the tech industry, the benchmark for system uptime is commonly set at 99.9%, with leaders often achieving up to 99.99% in ideal conditions. These values are crucial as they indicate the platform’s ability to deliver uninterrupted services, a key factor in customer satisfaction metrics. For further insights into establishing your tech groundwork, check out How Much Does It Cost to Start a Tech Company?.
How To Improve
- Implement robust infrastructure monitoring tools to detect and address incipient issues.
- Invest in high-quality cloud services and redundancy systems to ensure backup during peak usage.
- Execute scheduled maintenance during low-traffic periods and perform regular stress tests.
How To Calculate
To calculate System Uptime, determine the total time your system should be operational and subtract any downtime. The resulting value is divided by the total scheduled time and multiplied by 100 to express it as a percentage.
Example of Calculation
Assume TechVantage Solutions operates for 720 hours in a month and experiences 0.5 hours of downtime. Plugging into the formula:
This high uptime percentage indicates a robust and reliable service level that upholds customer satisfaction and reinforces operational efficiency KPIs.
Tips and Trics
- Monitor service performance continuously to quickly identify and resolve downtime issues.
- Schedule system maintenance during off-peak times to limit disruption and maintain high uptime levels.
- Invest in scalable, redundant infrastructure to enhance system resilience during high load periods.
- Incorporate dashboards that integrate operational efficiency KPIs and financial metrics for profitability to give a holistic view of business performance.