


Adventure park financial model example


5-Year Financial Projections
100% Editable
Investor-Approved Valuation Models
MAC/PC Compatible, Fully Unlocked
No Accounting Knowledge Needed
Adventure Park Bundle
This ready-made adventure park financial model template addresses the key challenges faced by founders in managing an outdoor adventure park. Engineered for accuracy, usability, and industry relevance, it facilitates precise financial planning for adventure activities in Austin. With features tailored for zip line parks in Texas and obstacle courses in Austin, this template saves time, supports data-driven decisions, and aligns with stakeholder expectations for innovative entertainment facilities.
Adventure Park Financial Model Template : Features
Fully Customizable Financial Model
Our adventure park financial model template is designed with industry-specific formulas and adaptable input fields, making it perfect for any outdoor adventure park concept. Whether you’re planning thrilling zip line activities or unique obstacle courses in Austin, this template enables seamless customization to fit your vision.
- Startup costs
- Revenue projections
- Operational expenses
- Safety systems

Comprehensive 5-Year Financial Projections
This financial model provides a detailed, five-year forecast tailored for an adventure park, ensuring you can strategically plan for growth and sustainability. With precise revenue, cost, and profit projections, you can navigate the financial landscape of outdoor adventure activities in Austin.
- Monthly revenue forecasts
- Annual financial projections
- Profitability analysis
- Break-even analysis

Startup Costs and Running Expenses
Prepare for your adventure park launch and daily operations with a comprehensive cost breakdown. This model offers insights into the financial requirements for both startup investments and ongoing expenses, essential for thriving in the competitive outdoor adventure market.
- Equipment and safety systems
- Land lease and improvements
- Staff salaries for adventure activities
- Marketing for corporate team building

Break-Even Analysis
Determine when your adventure park will become profitable with a precise break-even analysis. This tool helps you understand the sales volume needed to cover costs, allowing you to reach profitability more efficiently.
- Revenue vs. cost projections
- Fixed and variable cost analysis
- Break-even sales volume
- Profitability tracking

Built-In Industry Benchmarks
Utilize the financial model template to compare your adventure park's performance with industry standards. This feature provides valuable insights, ensuring your outdoor adventure park aligns with key metrics that drive success in the competitive landscape of adventure activities in Austin.
- Revenue per visitor
- Customer retention rate
- Average ticket price
- Operational cost percentage

Multi-Platform Compatibility
Access and manage your adventure park financial model seamlessly with full compatibility across Microsoft Excel (Windows and Mac) and Google Sheets. This flexibility allows for easy collaboration on your financial projections, ensuring your team stays aligned on the adventure activities in Austin.
- Works on Excel for Windows and Mac
- Collaborative editing in Google Sheets
- Accessible across multiple devices
- Ideal for planning corporate team building activities

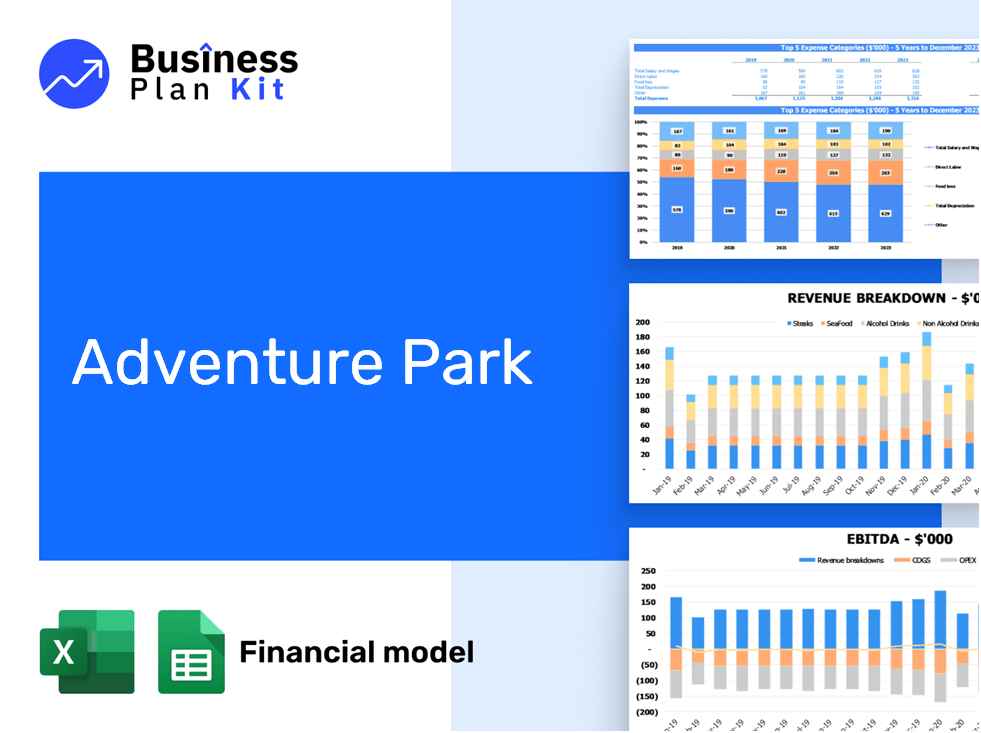
Visual Dashboard with Key Metrics
Enhance your adventure park's financial oversight with a visual dashboard that showcases essential metrics. This dynamic tool simplifies tracking revenue, expenses, and profitability, making it effortless to present your financial health to stakeholders.
- Revenue streams
- Expense categories
- Profit margins
- Performance indicators

Scenario Planning for Seasonal Variations
Navigate the ups and downs of visitor traffic at your adventure park with our scenario planning feature. Tailor your financial strategies to account for seasonal trends in outdoor adventure activities in Austin, ensuring you remain profitable year-round.
- Seasonal revenue forecasts
- Cost fluctuation models
- Staffing level adjustments
- Profitability analysis for peak seasons

Investor-Ready Presentation
Present your financial model with confidence, showcasing the potential of your outdoor adventure park. A well-structured financial overview highlights the viability of your unique outdoor adventure experiences, making it attractive to investors and partners.
- Clear revenue projections
- Polished financial summaries
- Professional formatting
- Detailed assumptions section

How to Use the Template

Download and Open
Simply purchase and download the financial model template, then access it instantly using Microsoft Excel or Google Sheets. No installation or technical expertise required—just open and start working.

Input Key Data:
Enter your business-specific numbers, including revenue projections, costs, and investment details. The pre-built formulas will automatically calculate financial insights, saving you time and effort.

Analyse Results:
Leverage the investor-ready format to confidently showcase your financial projections to banks, franchise representatives, or investors. Impress stakeholders with clear, data-driven insights and professional reports.

Present to Stakeholders:
Leverage the investor-ready format to confidently present your projections to banks, franchise representatives, or investors.