


Augmented reality historical sightseeing tours financial model example


5-Year Financial Projections
100% Editable
Investor-Approved Valuation Models
MAC/PC Compatible, Fully Unlocked
No Accounting Knowledge Needed
Augmented Reality Historical Sightseeing Tours Bundle
This ready-made augmented reality historical sightseeing tours financial model template addresses key challenges founders face in financial planning. Designed for accuracy, usability, and industry relevance, it enables comprehensive forecasts for AR historical sightseeing, guided AR tours in Boston, and self-guided historical experiences. Save time while making data-driven decisions that align with stakeholders' expectations, leveraging technology in tourism for immersive historical tours.
Augmented Reality Historical Sightseeing Tours Financial Model Template : Features
Fully Customizable Financial Model
This financial model template for augmented reality historical sightseeing tours is designed with industry-specific formulas and flexible fields, making it easy to adapt for any AR historical tours concept. Whether you’re offering guided AR tours in Boston or self-guided historical experiences, this template meets your requirements seamlessly.
- Startup costs
- Revenue streams
- Marketing expenses
- Operational forecasts

Comprehensive 5-Year Financial Projections
This financial model provides a detailed forecast for up to five years, crucial for planning the success of augmented reality historical sightseeing tours. With precise revenue, cost, and profit projections, you can strategically navigate the evolving landscape of educational tourism experiences.
- Monthly revenue estimates
- Annual cost breakdown
- Profitability forecasts
- Valuation metrics

Startup Costs and Running Expenses
Plan your launch and daily operations for augmented reality historical sightseeing tours with a detailed cost breakdown. This model clarifies both startup investment requirements and ongoing operational expenses, ensuring you are well-prepared for success.
- AR technology setup
- Marketing and promotional costs
- Staff training for guided AR tours
- Insurance and permits

Break-Even Analysis
Determine when your augmented reality historical sightseeing tours will become profitable with a precise break-even analysis. This insight helps you understand the sales volume needed to cover costs and achieve profitability sooner.
- Revenue vs. cost projections
- Fixed and variable cost analysis
- Break-even sales volume
- Profitability tracking

Built-In Industry Benchmarks
Utilize industry benchmarks tailored for augmented reality historical sightseeing tours to evaluate your business's financial health. These metrics enable you to measure your performance against established standards, ensuring you stay competitive in the educational tourism market.
- AR technology adoption rates
- Average revenue per tour
- Customer satisfaction scores
- Market growth rates

Multi-Platform Compatibility
Access and customize your augmented reality historical sightseeing tours financial model seamlessly with compatibility across Microsoft Excel (Windows and Mac) and Google Sheets. This flexibility enhances collaboration and ensures your team can work together effortlessly.
- Works on Excel for Windows and Mac
- Collaborative editing in Google Sheets
- Accessible on multiple devices
- Supports interactive historical tours

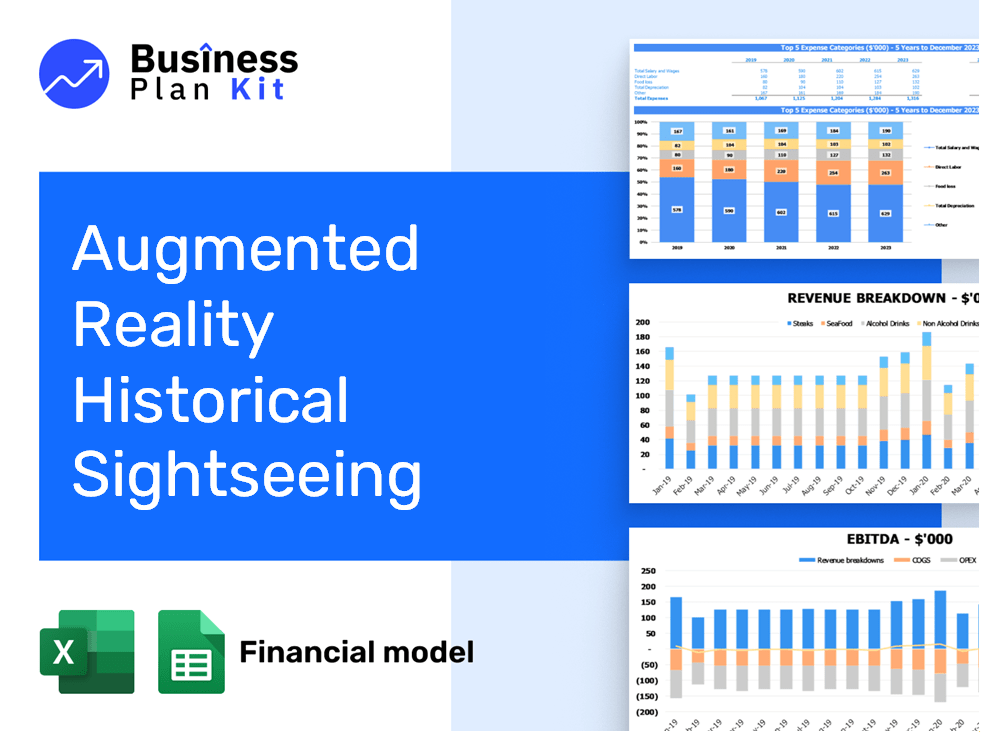
Visual Dashboard with Key Metrics
Enhance your augmented reality historical sightseeing tours' financial tracking with a robust visual dashboard. This tool allows you to easily monitor key metrics, ensuring that your guided AR tours Boston and self-guided historical experiences are on the right financial path.
- Revenue growth
- Expense tracking
- Profit margins
- Visitor engagement

Scenario Planning for Seasonal Variations
Prepare for seasonal fluctuations in the augmented reality historical sightseeing market. Utilize our scenario planning tools to adjust for changes in tourist traffic and costs associated with guided AR tours Boston and self-guided historical experiences.
- Seasonal revenue forecasts
- Cost simulation adjustments
- Staffing analysis for peak times
- Profitability insights for tours

Investor-Ready Presentation
Impress potential investors or lenders with a polished financial model presentation. Clear summaries and well-structured financials ensure your augmented reality historical sightseeing tours concept stands out as a professional and viable opportunity.
- Clear revenue projections
- Polished visual reports
- Professional formatting
- Detailed assumption breakdown

How to Use the Template

Download and Open
Simply purchase and download the financial model template, then access it instantly using Microsoft Excel or Google Sheets. No installation or technical expertise required—just open and start working.

Input Key Data:
Enter your business-specific numbers, including revenue projections, costs, and investment details. The pre-built formulas will automatically calculate financial insights, saving you time and effort.

Analyse Results:
Leverage the investor-ready format to confidently showcase your financial projections to banks, franchise representatives, or investors. Impress stakeholders with clear, data-driven insights and professional reports.

Present to Stakeholders:
Leverage the investor-ready format to confidently present your projections to banks, franchise representatives, or investors.