


Boat trip financial model example


5-Year Financial Projections
100% Editable
Investor-Approved Valuation Models
MAC/PC Compatible, Fully Unlocked
No Accounting Knowledge Needed
Boat Trip Bundle
This ready-made luxury boat trip financial model template addresses the challenges founders face in planning South Florida yacht experiences. It ensures accuracy and usability, integrating industry relevance for guided boat excursions and premium coastal tours. Save time while enabling data-driven decisions for educational boat tours, meeting expectations for interactive maritime adventure experiences with features like technology-enhanced boat tours and certified guides.
Boat Trip Financial Model Template : Features
Fully Customizable Financial Model
This boat trip financial model template is designed with industry-specific formulas and adaptable fields, enabling you to tailor it for any luxury boat trip concept. Whether you're offering guided boat excursions or premium coastal tours, this model seamlessly fits your vision.
- Initial investment costs
- Pricing for tours
- Staffing expenses
- Operational overhead

Comprehensive 5-Year Financial Projections
The model provides a detailed financial forecast for up to five years, crucial for planning your luxury boat trip offerings. Break down revenues, costs, and profits to ensure sustainable growth in the competitive South Florida market.
- Monthly revenue forecasts
- Annual financial projections
- Profitability analysis
- Cost breakdown for educational boat tours

Startup Costs and Running Expenses
Plan your boat trip launch and daily operations effectively with a detailed cost breakdown. The model provides clarity on both startup investment requirements and ongoing operational expenses.
- Luxury vessels for hire
- Staff salaries and payroll
- Equipment and technology
- Marketing and promotions

Break-Even Analysis
Determine when your boat trip will start generating profits with a precise break-even analysis. This tool helps you understand the sales volume needed to cover costs and achieve profitability sooner.
- Revenue vs. cost projections
- Fixed and variable cost analysis
- Break-even sales volume
- Profitability tracking

Built-In Industry Benchmarks
Utilize the included industry benchmarks to evaluate your boat trip's financial performance against established standards. This feature ensures you can position your luxury boat trip effectively within the competitive landscape of South Florida.
- Revenue per trip
- Customer acquisition cost
- Average trip duration
- Repeat customer rate

Multi-Platform Compatibility
Access and customize your boat trip financial model seamlessly across Microsoft Excel (Windows and Mac) and Google Sheets. This flexibility ensures you can manage your luxury boat trip operations and collaborate on educational boat tours with ease.
- Compatible with Excel (Windows/Mac)
- Real-time collaboration in Google Sheets
- Accessible from any device
- Perfect for guided boat excursions

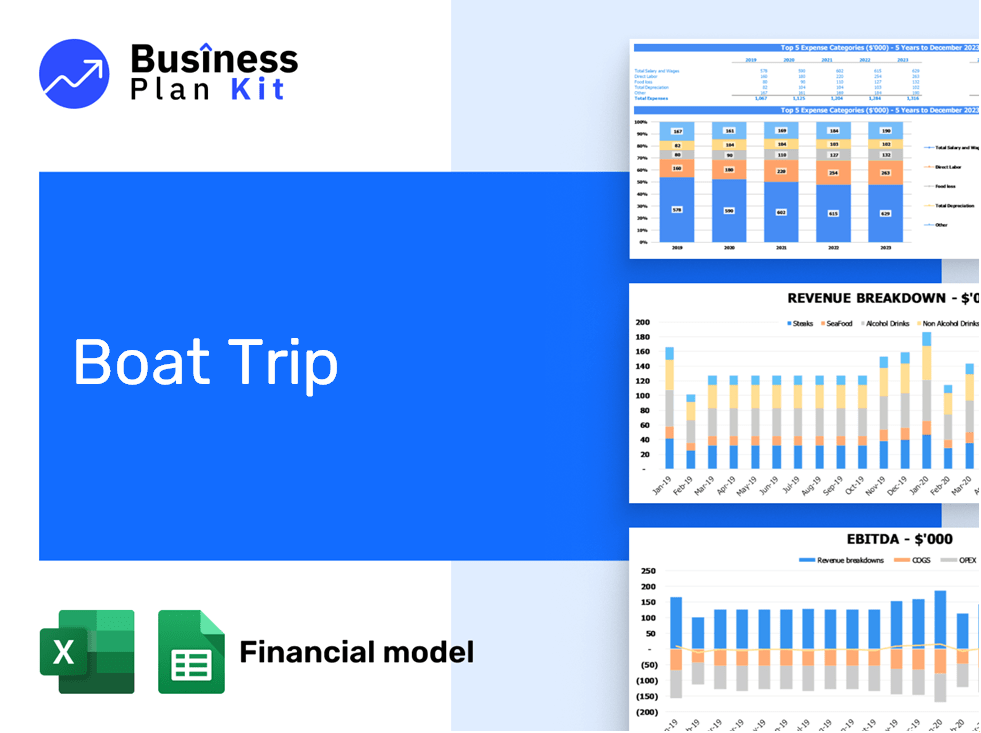
Visual Dashboard with Key Metrics
Enhance your boat trip's financial oversight with a dynamic visual dashboard. This tool transforms your financial data into clear, actionable insights, making it easier to track revenue, expenses, and profitability for your luxury boat trip.
- Sales trends
- Cost breakdowns
- Profitability analysis
- Key performance indicators (KPIs)

Scenario Planning for Seasonal Variations
Navigate the ebb and flow of demand with our scenario planning tools tailored for the luxury boat trip market. Adjust key metrics to see how seasonal shifts affect your financial outlook.
- Seasonal revenue forecasts
- Cost variation simulations
- Staffing needs assessment
- Profitability analysis for peak seasons

Investor-Ready Presentation
Captivate potential investors with a sophisticated financial model tailored for a luxury boat trip. This presentation showcases your unique offering of educational boat tours, ensuring your business concept resonates as a premium opportunity in South Florida's vibrant coastal market.
- Comprehensive revenue projections
- Engaging visual summaries
- Professional formatting
- Thorough assumption details

How to Use the Template

Download and Open
Simply purchase and download the financial model template, then access it instantly using Microsoft Excel or Google Sheets. No installation or technical expertise required—just open and start working.

Input Key Data:
Enter your business-specific numbers, including revenue projections, costs, and investment details. The pre-built formulas will automatically calculate financial insights, saving you time and effort.

Analyse Results:
Leverage the investor-ready format to confidently showcase your financial projections to banks, franchise representatives, or investors. Impress stakeholders with clear, data-driven insights and professional reports.

Present to Stakeholders:
Leverage the investor-ready format to confidently present your projections to banks, franchise representatives, or investors.