


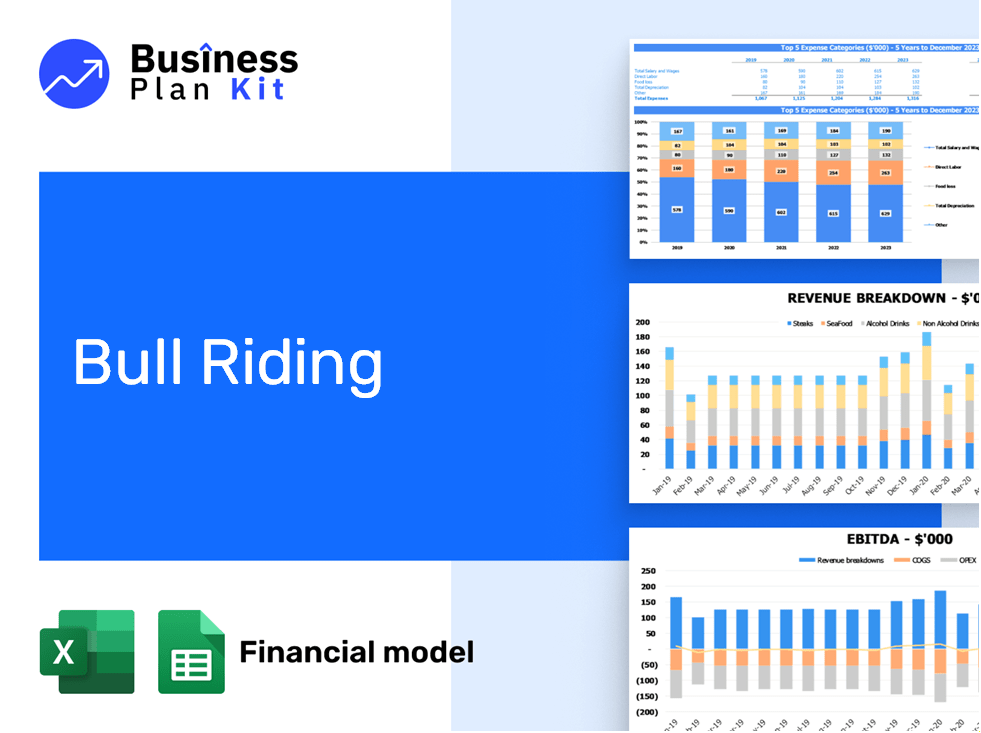
Bull riding financial model example


5-Year Financial Projections
100% Editable
Investor-Approved Valuation Models
MAC/PC Compatible, Fully Unlocked
No Accounting Knowledge Needed
Bull Riding Bundle
This ready-made financial model template for the bull riding experience addresses key challenges faced by founders in the modern rodeo events landscape. Focusing on accuracy, usability, and industry relevance, it empowers you to craft precise financial forecasts, integrating immersive bull riding elements and technology. The template supports data-driven decisions, aligning with western sports entertainment trends, and caters to stakeholder expectations, ultimately enhancing rodeo audience growth.
Bull Riding Financial Model Template : Features
Fully Customizable Financial Model
Our bull riding financial model template is designed with flexibility in mind, featuring pre-filled industry-specific formulas and assumptions. This allows you to easily tailor it for any modern rodeo events concept. Whether you're enhancing traditional bull riding competitions or integrating contemporary rodeo shows, this template fits seamlessly into your vision.
- Revenue streams
- Event cost estimates
- Participant fees
- Spectator engagement

Comprehensive 5-Year Financial Projections
This financial model provides a robust framework for forecasting the bull riding experience over five years. With a focus on modern rodeo events, it allows you to analyze revenue streams and costs while enhancing spectator engagement through innovative technology.
- Monthly revenue forecasts
- Annual profit projections
- Cost analysis for modern rodeo shows
- Break-even analysis for immersive experiences

Startup Costs and Running Expenses
Plan your bull riding launch and operations effectively with detailed cost breakdowns. This model provides clarity on both startup investment requirements and ongoing operational expenses, ensuring a successful immersive bull riding experience.
- Equipment and technology
- Venue rental costs
- Staff wages and training
- Marketing and promotional expenses

Break-Even Analysis
Determine when your bull riding experience will begin generating profits with a precise break-even analysis. By understanding the sales volume needed to cover costs, you can accelerate your journey to profitability in modern rodeo events.
- Revenue vs. cost projections
- Fixed and variable cost analysis
- Break-even sales volume
- Profitability tracking

Built-In Industry Benchmarks
Utilize industry benchmarks specifically tailored for the bull riding experience to measure your performance against established standards. This feature aids in aligning your modern rodeo events with successful metrics, ensuring your immersive bull riding initiatives resonate with both participants and spectators.
- Audience engagement rates
- Event profitability ratios
- Safety compliance metrics
- Revenue per attendee

Multi-Platform Compatibility
Access and edit your bull riding financial model seamlessly with full compatibility across Microsoft Excel (Windows and Mac) and Google Sheets. This flexibility enhances collaboration, allowing your team to engage in modern rodeo events from anywhere, boosting the immersive bull riding experience.
- Excel compatibility for all devices
- Real-time collaboration in Google Sheets
- Accessible for rodeo fan engagement
- Supports interactive rodeo experiences

Visual Dashboard with Key Metrics
Enhance the bull riding experience by utilizing a visual dashboard that showcases essential financial metrics. This tool simplifies the tracking of revenue streams and expenses, making it easier to present insights to stakeholders and gauge the success of modern rodeo events.
- Revenue growth
- Expense tracking
- Profit margins
- Engagement metrics

Scenario Planning for Seasonal Variations
Anticipate the ebb and flow of the bull riding experience with our scenario planning feature. This tool allows you to adjust key factors such as participant engagement and event scheduling, helping you understand how seasonal variations affect your financial outlook.
- Revenue projections for peak seasons
- Cost adjustments for off-peak events
- Staffing needs for modern rodeo events
- Profitability analysis for immersive bull riding

Investor-Ready Presentation
Capture the attention of potential investors with a sophisticated financial model tailored for the bull riding experience. By showcasing clear financial projections and innovative strategies, your proposal will resonate in the competitive landscape of modern rodeo events.
- Structured financial summaries
- Engaging visual reports
- Professional formatting
- Comprehensive revenue analysis

How to Use the Template

Download and Open
Simply purchase and download the financial model template, then access it instantly using Microsoft Excel or Google Sheets. No installation or technical expertise required—just open and start working.

Input Key Data:
Enter your business-specific numbers, including revenue projections, costs, and investment details. The pre-built formulas will automatically calculate financial insights, saving you time and effort.

Analyse Results:
Leverage the investor-ready format to confidently showcase your financial projections to banks, franchise representatives, or investors. Impress stakeholders with clear, data-driven insights and professional reports.

Present to Stakeholders:
Leverage the investor-ready format to confidently present your projections to banks, franchise representatives, or investors.