


Campground financial model example


5-Year Financial Projections
100% Editable
Investor-Approved Valuation Models
MAC/PC Compatible, Fully Unlocked
No Accounting Knowledge Needed
Campground Bundle
This ready-made financial model template for a campground near Portland addresses key challenges founders face, prioritizing accuracy, usability, and industry relevance. It streamlines financial planning for family camping in Oregon, integrating detailed projections for outdoor recreation, glamping, and structured activities. By saving time and enabling data-driven decisions, it meets stakeholder expectations while enhancing family-friendly outdoor adventures and nature retreats.
Campground Financial Model Template : Features
Fully Customizable Financial Model
Our campground financial model template is designed with pre-filled industry-specific formulas and adaptable fields, making it easy to tailor for any family camping Oregon concept. Whether you're focusing on tent camping Oregon or glamping near Portland, this template meets your unique needs seamlessly.
- Initial investment costs
- Revenue from camping activities
- Operational expenses
- Profit margins analysis

Comprehensive 5-Year Financial Projections
The model provides detailed financial forecasts for up to five years, essential for planning growth in the campground sector. Break down revenue streams, operating costs, and profitability to ensure your outdoor recreation near Portland thrives.
- Monthly revenue forecasts
- Annual financial projections
- Cost analysis for camping activities
- Profitability metrics for family camping

Startup Costs and Running Expenses
Plan your campground launch and daily operations effectively with detailed cost breakdowns. This model offers insights into both startup investment requirements and ongoing operational expenses, crucial for success in the outdoor recreation Portland market.
- Site preparation costs
- Permits and licenses
- Staff training and salaries
- Marketing and promotional expenses

Break-Even Analysis
Determine when your campground near Portland will start generating profits with a precise break-even analysis. This essential tool helps you understand the sales volume needed to cover costs and achieve profitability in your outdoor recreation business.
- Revenue vs. cost projections
- Fixed and variable cost analysis
- Break-even sales volume
- Profitability tracking

Built-In Industry Benchmarks
Utilize the campground's financial model template to compare your performance against industry benchmarks tailored for outdoor recreation near Portland. This feature aids in aligning your operations with successful metrics, ensuring you stay competitive in the family camping Oregon market.
- Occupancy rates
- Average revenue per site
- Customer satisfaction scores
- Seasonal trends

Multi-Platform Compatibility
Access and customize your campground financial model effortlessly with full compatibility across Microsoft Excel (Windows and Mac) and Google Sheets. This flexibility allows for seamless collaboration, whether you're planning family camping activities in Oregon or organizing outdoor educational programs.
- Works on Excel for Windows and Mac
- Collaborative editing in Google Sheets
- Accessible across multiple devices
- Ideal for family-friendly campgrounds

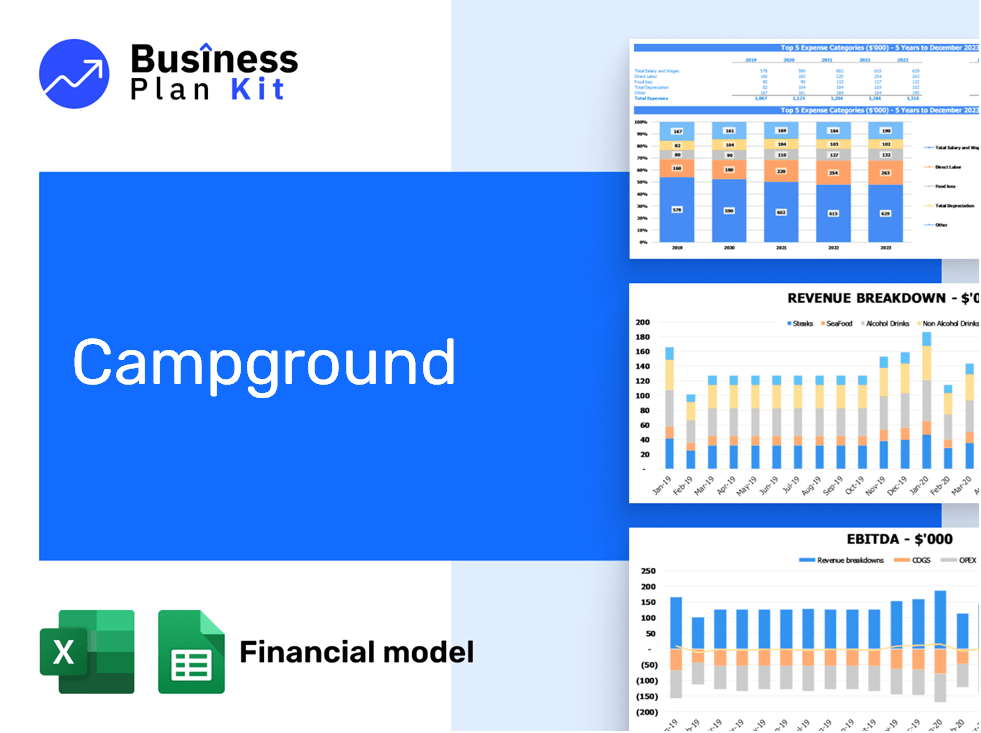
Visual Dashboard with Key Metrics
Enhance your campground's financial oversight with a dynamic visual dashboard. This tool offers a clear representation of revenue, expenses, and profitability, making it simple to present essential data to stakeholders and track performance effectively.
- Revenue trends
- Expense breakdowns
- Profit margins
- Key performance indicators

Scenario Planning for Seasonal Variations
Optimize your financial strategy with scenario planning tailored for the campground near Portland. This feature allows you to simulate how seasonal shifts affect your revenue and expenses, ensuring you stay ahead in the competitive outdoor recreation Portland market.
- Seasonal revenue forecasts
- Cost variation simulations
- Staffing needs analysis
- Profitability during peak seasons

Investor-Ready Presentation
Make a lasting impression on potential investors and partners with a meticulously crafted financial model tailored for a campground. Highlighting your unique offerings in family camping Oregon, this presentation showcases your vision for a premier outdoor recreation destination near Portland.
- Clear revenue projections
- Concise cost breakdowns
- Professional visual reports
- Thorough assumption documentation

How to Use the Template

Download and Open
Simply purchase and download the financial model template, then access it instantly using Microsoft Excel or Google Sheets. No installation or technical expertise required—just open and start working.

Input Key Data:
Enter your business-specific numbers, including revenue projections, costs, and investment details. The pre-built formulas will automatically calculate financial insights, saving you time and effort.

Analyse Results:
Leverage the investor-ready format to confidently showcase your financial projections to banks, franchise representatives, or investors. Impress stakeholders with clear, data-driven insights and professional reports.

Present to Stakeholders:
Leverage the investor-ready format to confidently present your projections to banks, franchise representatives, or investors.