


Drive in concerts financial model example


5-Year Financial Projections
100% Editable
Investor-Approved Valuation Models
MAC/PC Compatible, Fully Unlocked
No Accounting Knowledge Needed
Drive In Concerts Bundle
This ready-made drive-in concerts financial model template tackles the key challenges faced by founders in planning automotive entertainment events. Designed with accuracy, usability, and industry relevance, it facilitates comprehensive forecasts for live drive-in performances. Save time and resources while enabling data-driven decisions that meet stakeholder expectations, ensuring a seamless, socially distanced concert experience in car-friendly live shows.
Drive In Concerts Financial Model Template : Features
Fully Customizable Financial Model
The drive-in concerts financial model template is designed with industry-specific formulas and adaptable fields, making it easy to tailor to any live drive-in performances concept. Whether you're organizing a series of outdoor concert experiences or planning unique automotive entertainment events, this template provides the flexibility you need.
- Initial setup costs
- Ticket pricing strategy
- Logistics and staffing
- Marketing expenses

Comprehensive 5-Year Financial Projections
This financial model provides a detailed outlook for drive-in concerts, ensuring you can strategically plan for growth. By mapping out revenues, costs, and profits over five years, you can effectively navigate the outdoor concert experience landscape.
- Monthly revenue forecasts
- Annual profit projections
- Cost breakdown analysis
- Cash flow insights

Startup Costs and Running Expenses
Plan your drive-in concerts launch and operations with a comprehensive cost breakdown. Understanding these financial requirements is essential for a successful outdoor concert experience, ensuring you’re equipped for both initial investments and ongoing expenses.
- Venue setup costs
- Sound and lighting equipment
- Staffing and security expenses
- Marketing and promotional activities

Break-Even Analysis
Determine when your drive-in concerts will start generating profits with a precise break-even analysis. This tool helps you understand the sales volume needed to cover costs and achieve profitability efficiently.
- Revenue vs. cost projections
- Fixed and variable cost analysis
- Break-even sales volume
- Profitability tracking

Built-In Industry Benchmarks
Compare your drive-in concerts' financial performance with industry standards using benchmark data included in the template. This helps you align your business with proven metrics for success in the automotive entertainment events sector.
- Average ticket price
- Occupancy rates
- Revenue per vehicle
- Cost per live performance

Multi-Platform Compatibility
Access and customize your drive-in concerts financial model seamlessly with full compatibility across Microsoft Excel (Windows and Mac) and Google Sheets. This flexibility allows for real-time collaboration, ensuring your live drive-in performances are planned effectively.
- Works on Excel for Windows and Mac
- Collaborative editing in Google Sheets
- Accessible across multiple devices
- Perfect for planning outdoor concert experience

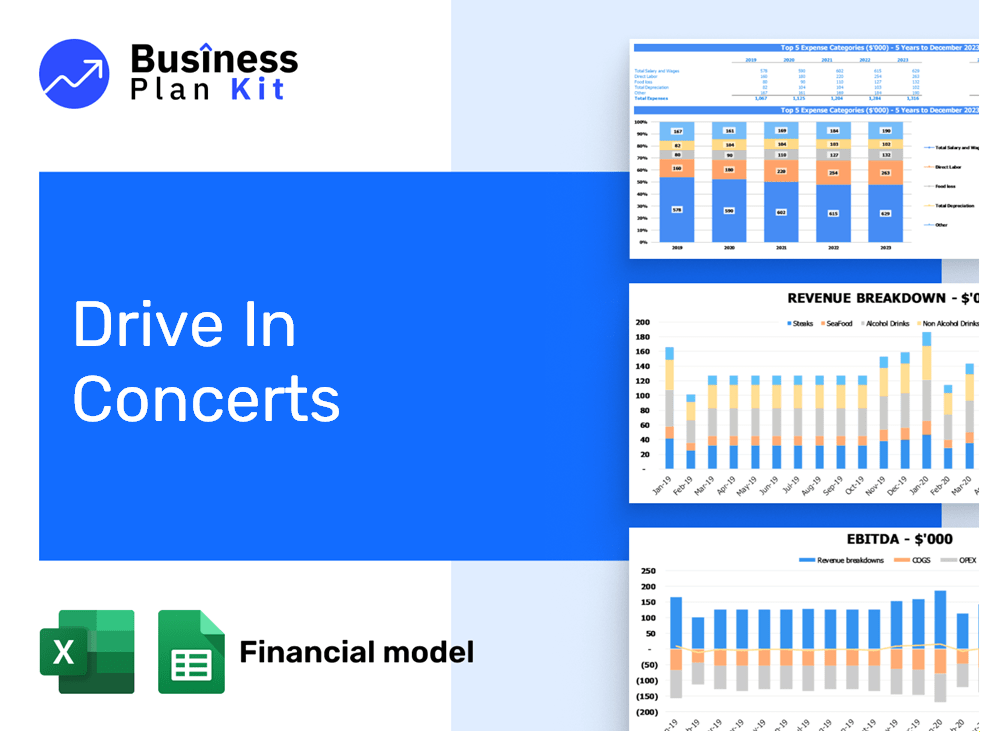
Visual Dashboard with Key Metrics
Enhance your drive-in concerts financial model with a visual dashboard that presents critical metrics at a glance. This tool simplifies tracking revenue, expenses, and profitability, making it effortless to showcase your live drive-in performances to stakeholders.
- Revenue streams
- Expense categories
- Profit margins
- Attendance metrics

Scenario Planning for Seasonal Variations
Adapt your financial strategy for drive-in concerts with our scenario planning feature. By simulating seasonal shifts, you can assess how changes in weather and holidays impact attendance and revenue for live drive-in performances.
- Seasonal revenue forecasts
- Cost variation assessments
- Attendance fluctuation analysis
- Profitability during peak seasons

Investor-Ready Presentation
Present your drive-in concerts concept with a financial model that captures attention. A professional formatting style showcases your vision for live drive-in performances, making it an attractive opportunity for investors or partners.
- Clear revenue forecasts
- Visual performance metrics
- Structured financial summaries
- Comprehensive assumptions section

How to Use the Template

Download and Open
Simply purchase and download the financial model template, then access it instantly using Microsoft Excel or Google Sheets. No installation or technical expertise required—just open and start working.

Input Key Data:
Enter your business-specific numbers, including revenue projections, costs, and investment details. The pre-built formulas will automatically calculate financial insights, saving you time and effort.

Analyse Results:
Leverage the investor-ready format to confidently showcase your financial projections to banks, franchise representatives, or investors. Impress stakeholders with clear, data-driven insights and professional reports.

Present to Stakeholders:
Leverage the investor-ready format to confidently present your projections to banks, franchise representatives, or investors.