


Obstacle course race financial model example


5-Year Financial Projections
100% Editable
Investor-Approved Valuation Models
MAC/PC Compatible, Fully Unlocked
No Accounting Knowledge Needed
Obstacle Course Race Bundle
This ready-made obstacle course race financial model template addresses the key challenges founders face in financial planning for urban obstacle racing. Designed for accuracy, usability, and industry relevance, it empowers you to create comprehensive forecasts for military-inspired obstacle courses. Save time and resources with data-driven decisions that align with stakeholder expectations, be it urban fitness challenges or obstacle racing events.
Obstacle Course Race Financial Model Template : Features
Fully Customizable Financial Model
Our obstacle course race financial model template is designed with industry-specific formulas and adaptable input fields, making it easy to tailor for any urban obstacle racing concept. Whether you're organizing city obstacle races or military-inspired obstacle courses, this template streamlines your planning process.
- Startup costs
- Event pricing strategy
- Marketing expenses
- Revenue projections

Comprehensive 5-Year Financial Projections
The financial model provides a thorough forecast for the next five years, essential for navigating the urban obstacle racing landscape. With detailed revenue, cost, and profit projections, you'll be equipped to strategize for growth in city obstacle races and military-inspired obstacle courses.
- Monthly revenue breakdown
- Annual profit forecasts
- Cost analysis for events
- Yearly growth projections

Startup Costs and Running Expenses
Plan your obstacle course race launch and daily operations effectively with detailed cost breakdowns. The model provides clarity on both startup investment requirements and ongoing operational expenses.
- Course setup and equipment
- Marketing and promotions
- Staffing and training programs
- Insurance and permits

Break-Even Analysis
Determine when your obstacle course race will start generating profits with a thorough break-even analysis. This insight helps you understand the necessary sales volume to cover costs and achieve profitability sooner.
- Revenue vs. cost projections
- Fixed and variable cost analysis
- Break-even sales volume
- Profitability tracking

Built-In Industry Benchmarks
Utilize the financial model to compare your obstacle course race's performance against established industry benchmarks. This feature ensures that you are aligned with key metrics that define success in urban obstacle racing.
- Revenue per event
- Participant retention rates
- Cost per participant
- Average sponsorship revenue

Multi-Platform Compatibility
Your financial model for the obstacle course race is designed for maximum accessibility and collaboration. With seamless integration across Microsoft Excel (Windows and Mac) and Google Sheets, you can manage your urban obstacle racing financials effortlessly, no matter where you are.
- Compatible with Excel for Windows and Mac
- Real-time collaboration in Google Sheets
- Accessible on multiple devices
- Easy sharing for team challenges

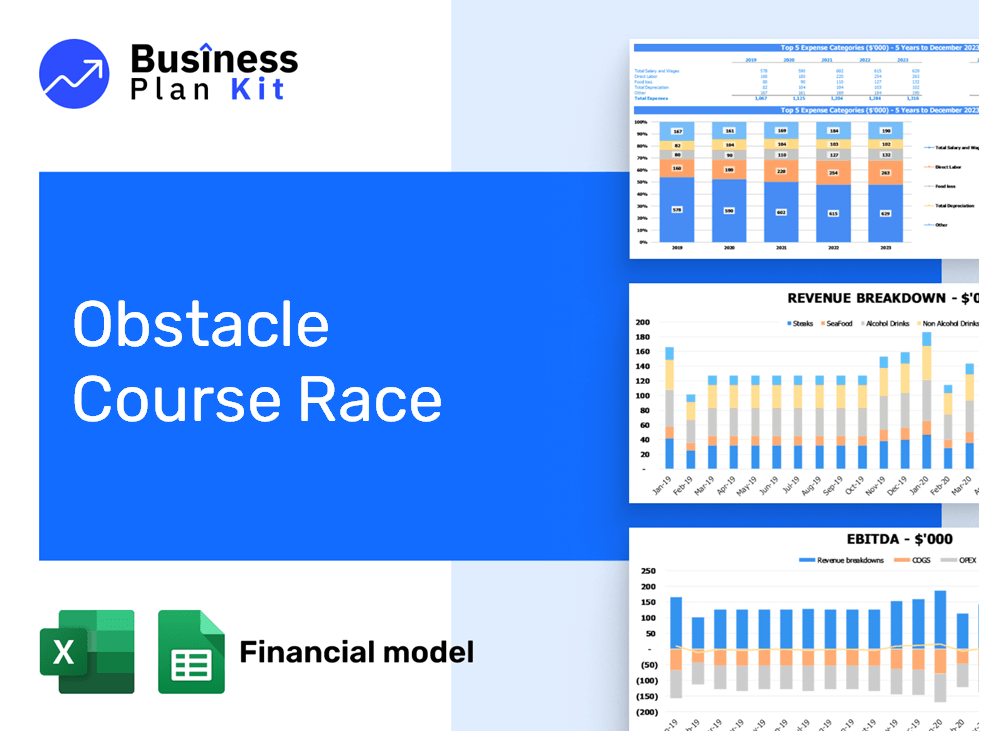
Visual Dashboard with Key Metrics
Utilize a dynamic visual dashboard to present your obstacle course race's financial data effectively. This tool allows you to visualize key metrics, making it simpler to track revenue, expenses, and profitability while engaging stakeholders in your urban obstacle racing venture.
- Revenue streams
- Expense categories
- Profit margins
- Event participation rates

Scenario Planning for Seasonal Variations
Navigate the ups and downs of urban obstacle racing with our scenario planning feature. Tailor your financial model to reflect the unique challenges of city obstacle races, ensuring you’re prepared for every season.
- Seasonal revenue forecasts
- Cost fluctuation analysis
- Staffing needs during events
- Profitability insights for peak seasons

Investor-Ready Presentation
Make a strong impression with a financial model tailored for the obstacle course race. This model showcases your potential to attract investors and partners, presenting your vision of urban obstacle racing with clarity and professionalism.
- Structured financial summaries
- Visual metrics for urban fitness challenges
- Professional design for presentations
- Comprehensive revenue projections

How to Use the Template

Download and Open
Simply purchase and download the financial model template, then access it instantly using Microsoft Excel or Google Sheets. No installation or technical expertise required—just open and start working.

Input Key Data:
Enter your business-specific numbers, including revenue projections, costs, and investment details. The pre-built formulas will automatically calculate financial insights, saving you time and effort.

Analyse Results:
Leverage the investor-ready format to confidently showcase your financial projections to banks, franchise representatives, or investors. Impress stakeholders with clear, data-driven insights and professional reports.

Present to Stakeholders:
Leverage the investor-ready format to confidently present your projections to banks, franchise representatives, or investors.