


Tapioca production financial model example


5-Year Financial Projections
100% Editable
Investor-Approved Valuation Models
MAC/PC Compatible, Fully Unlocked
No Accounting Knowledge Needed
Tapioca Production Bundle
This ready-made tapioca production financial model template effectively addresses the common challenges faced by founders in cassava processing. Designed with a focus on accuracy, usability, and industry relevance, it supports sustainable food ingredients and zero-waste production. By integrating local sourcing cassava and advanced technology, this template saves time, enables data-driven decisions, and meets the high standards of stakeholders and premium tapioca products manufacturers.
Tapioca Production Financial Model Template : Features
Fully Customizable Financial Model
Our tapioca production financial model template is designed with a robust framework, pre-filled with industry-specific formulas and assumptions. This allows you to tailor it effortlessly for any cassava processing venture. Whether you aim to produce premium tapioca products or implement zero-waste production strategies, this model adapts seamlessly to your objectives.
- Initial investment costs
- Revenue projections
- Operational expenses
- Break-even analysis

Comprehensive 5-Year Financial Projections
This financial model delivers detailed projections for tapioca production over the next five years, enabling strategic planning for sustainable growth. By analyzing revenue streams, operating costs, and profitability, you can make data-driven decisions that align with eco-friendly food manufacturing practices.
- Monthly revenue breakdown
- Annual cost analysis
- Profitability forecasts
- Investment requirements

Startup Costs and Running Expenses
Plan your tapioca production launch and daily operations effectively with detailed cost breakdowns. The model provides clarity on both startup investment requirements and ongoing operational expenses.
- Equipment for cassava processing
- Facility lease and improvements
- Staff salaries and payroll
- Raw materials and supplies

Break-Even Analysis
Determine when your tapioca production will become profitable with a precise break-even analysis. This crucial tool helps you understand the sales volume needed to cover costs, ensuring a smooth path toward profitability.
- Revenue vs. cost projections
- Fixed and variable cost analysis
- Break-even sales volume
- Profitability tracking

Built-In Industry Benchmarks
Utilize the financial model’s integrated industry benchmarks to evaluate your tapioca production's performance against recognized standards. This feature ensures you are aligned with key metrics that drive success in cassava processing and sustainable food ingredients.
- Cost of goods sold
- Operating margin
- Return on investment
- Inventory turnover

Multi-Platform Compatibility
Access and edit your tapioca production financial model anytime, anywhere with full compatibility across Microsoft Excel (Windows and Mac) and Google Sheets. Collaborate with your team effortlessly while ensuring a seamless workflow in your cassava processing operations.
- Works on Excel for Windows and Mac
- Collaborative editing in Google Sheets
- Accessible across multiple devices
- Supports eco-friendly food manufacturing

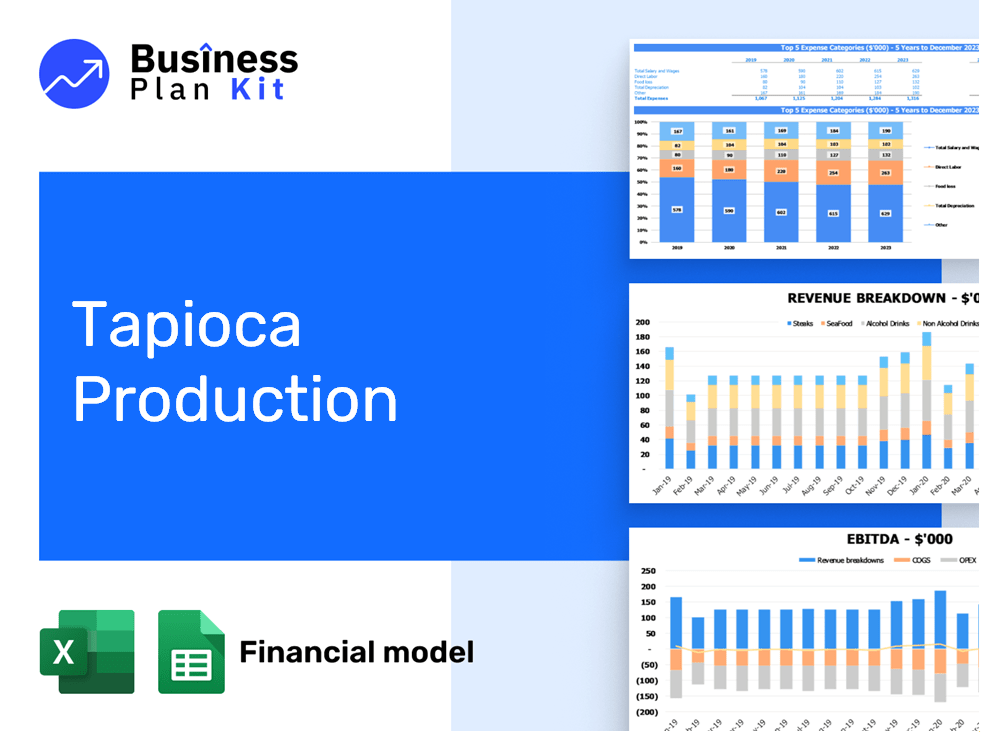
Visual Dashboard with Key Metrics
Enhance your tapioca production insights with a visual dashboard that effectively showcases financial data. This tool simplifies tracking revenue, expenses, and profitability, making it easier to present to stakeholders.
- Sales trends
- Cost breakdowns
- Profitability analysis
- Key performance indicators (KPIs)

Scenario Planning for Seasonal Variations
Prepare for the dynamic nature of tapioca production with our scenario planning feature. Adjust key variables like cassava availability and production costs to understand how seasonal fluctuations affect your financial landscape.
- Seasonal revenue forecasts
- Cost variation analysis
- Resource allocation strategies
- Profitability insights for seasons

Investor-Ready Presentation
Present your tapioca production venture with a compelling financial model that captivates investors and partners. A well-structured presentation highlights the viability of your cassava processing operation, showcasing its commitment to sustainable food ingredients and zero-waste production.
- Clear financial summaries
- Engaging visual reports
- Professional layout
- Thorough assumption documentation

How to Use the Template

Download and Open
Simply purchase and download the financial model template, then access it instantly using Microsoft Excel or Google Sheets. No installation or technical expertise required—just open and start working.

Input Key Data:
Enter your business-specific numbers, including revenue projections, costs, and investment details. The pre-built formulas will automatically calculate financial insights, saving you time and effort.

Analyse Results:
Leverage the investor-ready format to confidently showcase your financial projections to banks, franchise representatives, or investors. Impress stakeholders with clear, data-driven insights and professional reports.

Present to Stakeholders:
Leverage the investor-ready format to confidently present your projections to banks, franchise representatives, or investors.