


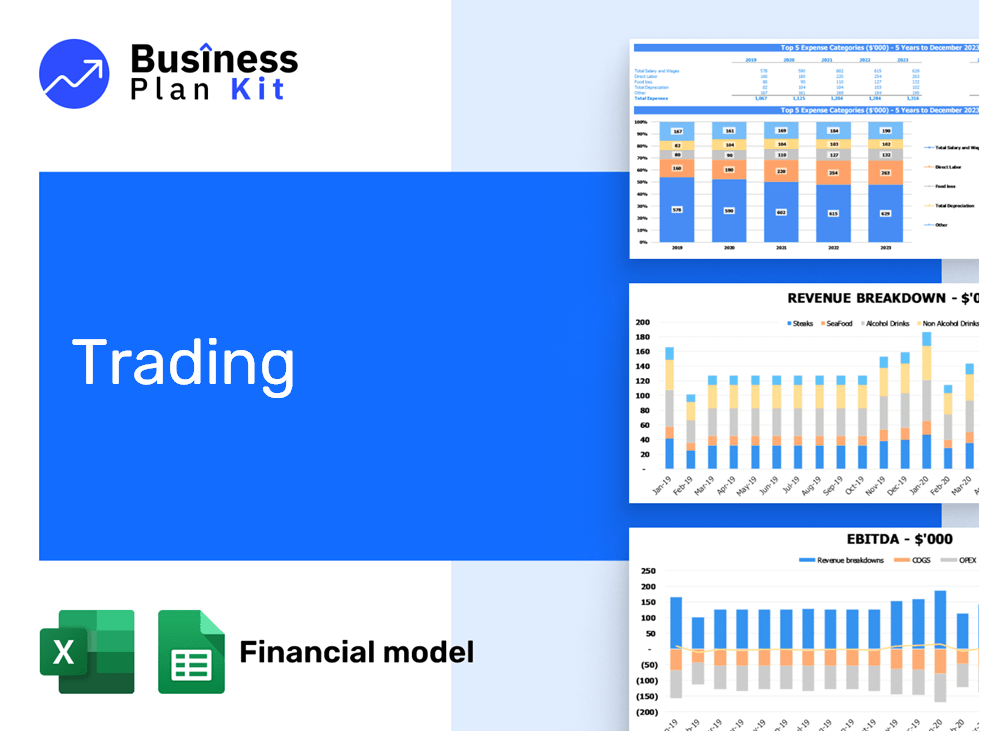
Trading financial model example


5-Year Financial Projections
100% Editable
Investor-Approved Valuation Models
MAC/PC Compatible, Fully Unlocked
No Accounting Knowledge Needed
Trading Bundle
This ready-made trading financial model template tackles key challenges in trading business planning by focusing on accuracy, usability, and industry relevance. It integrates AI trading analytics with market data analysis tools, offering scalable trading solutions and customizable trading software. Designed to enhance trading operations management, it saves time and empowers data-driven decisions, aligning with stakeholder expectations and supporting entrepreneurial trading tools.
Trading Financial Model Template : Features
Fully Customizable Financial Model
Our trading financial model template is designed with pre-filled industry-specific formulas and customizable fields, making it simple to adapt to any trading business planning concept. Whether you're utilizing AI trading analytics or managing trading operations, this template provides the flexibility you need to succeed in a dynamic market.
- Initial investment breakdown
- Revenue forecasts
- Expense tracking
- Profitability analysis

Comprehensive 5-Year Financial Projections
The financial model provides a robust framework for creating comprehensive projections tailored for trading. With detailed revenue, cost, and profit forecasts, you can navigate the complexities of your trading operations management effectively. Leverage AI trading analytics and market data analysis tools to enhance your planning.
- Monthly revenue insights
- Annual cost breakdowns
- Profitability forecasts
- Scalable trading solutions

Startup Costs and Running Expenses
Plan your trading business launch and daily operations effectively with detailed cost breakdowns. The model provides clarity on both startup investment requirements and ongoing operational expenses.
- Technology infrastructure
- Market data subscriptions
- Staff salaries and payroll
- Marketing and customer acquisition

Break-Even Analysis
Pinpoint when your trading operations will become profitable with a precise break-even analysis. This tool helps you understand the sales volume necessary to cover costs and achieve profitability efficiently.
- Revenue vs. cost insights
- Fixed and variable costs
- Break-even sales target
- Profitability monitoring

Built-In Industry Benchmarks
Utilize comprehensive trading performance metrics to evaluate your trading operations management against industry standards. This feature empowers users to leverage AI trading analytics for data-driven decisions and strategic planning.
- Trade execution speed
- Win-loss ratio
- Average return on investment
- Cost per trade

Multi-Platform Compatibility
Experience seamless access to your trading financial model with full compatibility across Microsoft Excel (Windows and Mac) and Google Sheets. This flexibility allows for real-time collaboration and efficient trading operations management.
- Works on Excel for Windows and Mac
- Collaborative editing in Google Sheets
- Real-time trading insights
- Customizable trading software

Visual Dashboard with Key Metrics
Enhance your trading business planning with a visual dashboard that showcases critical financial metrics. By leveraging AI trading analytics, this tool provides real-time trading insights, making it simpler to manage trading operations and present data to stakeholders.
- Revenue tracking
- Expense visualization
- Profitability metrics
- Market trend analysis

Scenario Planning for Seasonal Variations
Navigate the complexities of seasonal trading with our advanced scenario planning feature. Leverage AI trading analytics to adjust your financial strategies based on real-time market data analysis tools, ensuring your trading operations management remains agile and responsive.
- Seasonal revenue forecasts
- Cost fluctuation models
- Resource allocation insights
- Profit analysis for peak seasons

Investor-Ready Presentation
Capture the attention of potential investors with a well-crafted financial model tailored for the trading industry. The polished presentation showcases your trading business planning capabilities, ensuring your concept resonates as a professional and viable opportunity.
- Clear revenue projections
- Visual market data analysis
- Professional formatting
- Detailed trading metrics

How to Use the Template

Download and Open
Simply purchase and download the financial model template, then access it instantly using Microsoft Excel or Google Sheets. No installation or technical expertise required—just open and start working.

Input Key Data:
Enter your business-specific numbers, including revenue projections, costs, and investment details. The pre-built formulas will automatically calculate financial insights, saving you time and effort.

Analyse Results:
Leverage the investor-ready format to confidently showcase your financial projections to banks, franchise representatives, or investors. Impress stakeholders with clear, data-driven insights and professional reports.

Present to Stakeholders:
Leverage the investor-ready format to confidently present your projections to banks, franchise representatives, or investors.