


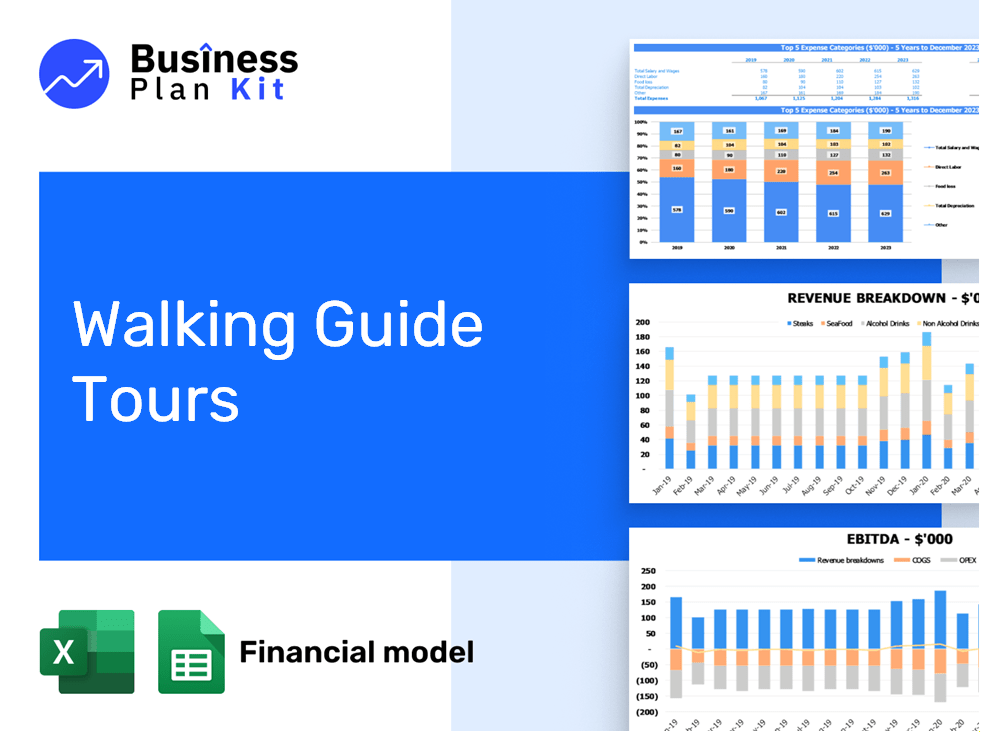
Walking guide tours financial model example


5-Year Financial Projections
100% Editable
Investor-Approved Valuation Models
MAC/PC Compatible, Fully Unlocked
No Accounting Knowledge Needed
Walking Guide Tours Bundle
The ready-made financial model template for walking guide tours addresses key challenges faced by founders, focusing on accuracy, usability, and industry relevance. Tailored for city tours Denver and historical walking tours, it supports revenue generation in tourism through immersive walking experiences. By incorporating augmented reality city tours and expert guided tours Denver, this template saves time, empowers data-driven decisions, and meets stakeholder expectations with precision.
Walking Guide Tours Financial Model Template : Features
Fully Customizable Financial Model
Our walking guide tours financial model template is designed with flexibility in mind, featuring industry-specific formulas and customizable fields. This allows you to tailor it for any type of city tours Denver concept, from expert guided tours Denver to immersive walking experiences that incorporate augmented reality technology.
- Initial investment costs
- Revenue generation strategies
- Staffing and payroll
- Operational expenses

Comprehensive 5-Year Financial Projections
This financial model provides a detailed forecast for walking guide tours over a five-year period, ensuring you can strategically plan for growth in the competitive city tours Denver market. By breaking down revenue streams, expenses, and profitability, you can optimize your business decisions.
- Monthly revenue forecasts
- Annual financial projections
- Profitability analysis
- Cost breakdown for augmented reality city tours

Startup Costs and Running Expenses
Plan your walking guide tours launch and daily operations effectively with detailed cost breakdowns. The model provides clarity on both startup investment requirements and ongoing operational expenses.
- Technology setup for augmented reality
- Certified guide training costs
- Marketing for city tours Denver
- Insurance and permits

Break-Even Analysis
Discover when your walking guide tours will start generating profits through a precise break-even analysis. This tool helps you understand the sales volume needed to cover costs, ensuring a quicker path to profitability.
- Revenue vs. cost projections
- Fixed and variable cost analysis
- Break-even sales volume
- Profitability tracking

Built-In Industry Benchmarks
Utilize the financial model's integrated benchmarks to measure your walking guide tours' performance against industry standards. This feature is essential for aligning your city tours Denver with successful metrics.
- Revenue per tour
- Customer acquisition cost
- Tour guide efficiency
- Average customer rating

Multi-Platform Compatibility
Access and manage your walking guide tours financial model seamlessly with full compatibility across Microsoft Excel (Windows and Mac) and Google Sheets. This flexibility allows for real-time collaboration, ensuring your team can work together on immersive walking experiences.
- Works on Excel for Windows and Mac
- Collaborative editing in Google Sheets
- Accessible across multiple devices
- Perfect for expert guided tours Denver

Visual Dashboard with Key Metrics
Enhance your walking guide tours financial model with a visual dashboard that showcases essential metrics. This dynamic tool allows you to monitor revenue, expenses, and profitability, making it effortless to present your progress in city tours Denver.
- Revenue streams
- Expense tracking
- Profit margins
- Growth indicators

Scenario Planning for Seasonal Variations
Navigate the ebb and flow of tourism with our scenario planning feature tailored for walking guide tours. Adjust key metrics like visitor numbers and service tiers to anticipate how seasonal shifts affect your financial outlook.
- Seasonal revenue forecasts
- Cost fluctuation analysis
- Staffing optimization strategies
- Profit margins in peak seasons

Investor-Ready Presentation
Elevate your pitch with a financial model designed for success. The polished presentation of your walking guide tours concept will resonate with potential investors, showcasing the unique blend of augmented reality and historical storytelling for city tours Denver.
- Clear financial summaries
- Professional formatting
- Engaging visual reports
- Detailed revenue projections

How to Use the Template

Download and Open
Simply purchase and download the financial model template, then access it instantly using Microsoft Excel or Google Sheets. No installation or technical expertise required—just open and start working.

Input Key Data:
Enter your business-specific numbers, including revenue projections, costs, and investment details. The pre-built formulas will automatically calculate financial insights, saving you time and effort.

Analyse Results:
Leverage the investor-ready format to confidently showcase your financial projections to banks, franchise representatives, or investors. Impress stakeholders with clear, data-driven insights and professional reports.

Present to Stakeholders:
Leverage the investor-ready format to confidently present your projections to banks, franchise representatives, or investors.